A procurement dashboard helps Chief Procurement Officers (CPOs) understand whether purchasing decisions are improving business performance or creating avoidable costs and supply risks. In industrial procurement, that means looking beyond purchase orders and total spend to track supplier reliability, sourcing outcomes, budget adherence, lead times, and material availability.
The right procurement dashboard connects these measures to operational and financial goals. It helps procurement leaders identify problems before they disrupt production, explain performance to finance teams, and decide where corrective action is needed. Modern procurement platforms such as Procbay help centralize procurement data, making these insights easier to track and act upon.
However, choosing the right metrics matters more than displaying a large number of charts. A useful dashboard turns procurement data into decisions that buyers, finance leaders, and operations teams can act on.
What Is a Procurement Dashboard, and Why Does Strategic Sourcing Need One?
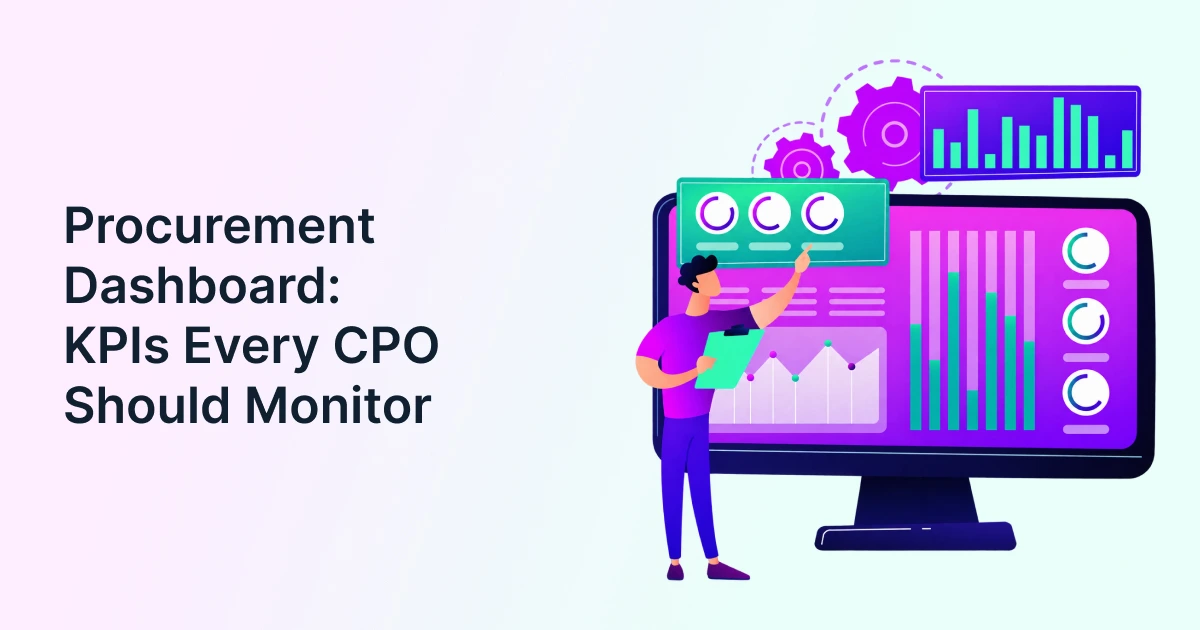
A procurement dashboard is a visual reporting interface that consolidates purchasing, supplier, sourcing, and financial data into a structured view of performance. It enables procurement leaders to monitor key performance indicators (KPIs), compare results against targets, and investigate exceptions.
For an industrial business, this could mean tracking steel purchases against budget, monitoring delivery performance for critical machine components, or identifying suppliers whose price increases threaten project margins.
Unlike a monthly spreadsheet, a well-designed procurement dashboard can bring several measures together and highlight where intervention is needed. Its usefulness depends on data quality, update frequency, and whether users can trace a KPI back to its underlying transactions.

Why visibility matters in strategic sourcing
Strategic sourcing decisions involve more than choosing the lowest quotation. Procurement teams must weigh commercial terms, technical compliance, supplier capacity, delivery commitments, and continuity of supply.
Without consolidated visibility, a buyer may select a lower-priced component supplier without realizing that longer lead times could delay production. A dashboard can bring price, delivery, quality, and supplier concentration into the same decision.
Useful visibility helps procurement leaders:
- Identify budget overruns before they become difficult to correct.
- Compare sourcing outcomes across plants, projects, categories, and suppliers.
- Detect delivery delays and quality issues affecting production.
- Understand whether negotiated savings translate into realized financial benefits.
- Give finance and operations a consistent view of procurement performance.
The process starts before an RFQ is issued. Structured procurement intake and demand capture helps teams establish what the business needs, why it needs it, and which budget or project should fund the purchase. Better intake data makes downstream reporting more meaningful.
Visibility is especially important when sourcing spans multiple locations, production facilities, and project teams. A CPO needs to see not just what has been purchased, but whether purchasing decisions support operational continuity and business objectives.
Procurement KPIs Every CPO Should Monitor
A procurement KPI dashboard should cover financial performance, sourcing efficiency, supplier reliability, operational continuity, and compliance. CPOs should prioritize measures that reveal business impact rather than tracking every available data point.
The Chartered Institute of Procurement & Supply (CIPS) identifies cost, time, quality, and value as important dimensions of procurement performance. These dimensions provide a useful foundation for selecting KPIs.
Cost and financial performance
Cost metrics show whether procurement is controlling expenditure and delivering measurable value.
- Realized cost savings: Verified reduction against an agreed baseline, adjusted for relevant volume and specification differences.
- Cost avoidance: Estimated future cost increases prevented through negotiation or alternative sourcing.
- Budget variance: Difference between actual expenditure and the approved budget.
- Spend under management: Percentage of organizational spend governed by procurement policies and processes.
- Contract compliance: Percentage of eligible spend made through approved contractual arrangements.
For example, a manufacturer may negotiate a 5% reduction in component prices. The dashboard should distinguish the negotiated reduction from actual savings after accounting for purchasing volumes, implementation dates, and compliance.
Sourcing and process efficiency
These KPIs help procurement leaders understand how efficiently requests move from business need to supplier award.
- Procurement cycle time: Time taken to complete a defined purchasing process.
- RFQ response rate: Percentage of invited suppliers submitting valid quotations.
- Competitive sourcing rate: Percentage of eligible purchases evaluated through a defined competitive process.
- Requisition-to-order time: Time between an approved requisition and purchase order issuance.
To investigate delays, teams can use procurement cycle time reduction strategies to identify approval bottlenecks, incomplete requirements, and repeated clarification rounds.
Supplier performance and supply risk
Industrial procurement depends on suppliers delivering the correct materials, components, and services at the required time and quality.
- On-time-in-full (OTIF): Percentage of deliveries arriving on time and in full.
- Supplier defect rate: Percentage of received units or lots failing defined quality requirements.
- Supplier lead-time variance: Difference between committed and actual delivery lead times.
- Supplier concentration: Share of spend or critical supply assigned to the largest suppliers.
- Critical supplier exposure: Value or volume of critical purchases dependent on suppliers with identified risk factors.
Compliance and sustainability
CPOs should also monitor whether purchasing follows organizational requirements and sustainability commitments.
- Approved supplier spend: Spend with suppliers meeting applicable approval requirements.
- Contract leakage: Eligible purchases made outside agreed contracts.
- Supplier ESG coverage: Percentage of relevant suppliers assessed against defined environmental, social, and governance criteria.
- Emissions intensity: Estimated emissions per unit purchased, produced, or transported, where reliable data is available.
The following table summarizes a practical starting point.
| KPI | How to measure it | Why a CPO needs it |
| Realized savings rate | Verified savings ÷ baseline spend | Validates financial value |
| Budget variance | Actual spend − budget | Flags overspending |
| Cycle time | Elapsed time between defined process milestones | Identifies delays |
| RFQ response rate | Valid responses ÷ invitations | Measures supplier engagement |
| OTIF | On-time, complete deliveries ÷ total deliveries | Reveals supply reliability |
| Supplier defect rate | Defective units ÷ units received | Tracks quality exposure |
| Spend under management | Procurement-governed spend ÷ addressable spend | Measures process control |
| ESG assessment coverage | Assessed in-scope suppliers ÷ total in-scope suppliers | Tracks sustainability oversight |
Every metric needs a defined formula, data owner, reporting period, and target. Without consistent definitions, comparisons between plants, categories, or business units may be misleading.
How Should CPOs Benchmark Procurement KPIs and Set Realistic Targets?
A KPI becomes useful when procurement leaders can compare it against a meaningful baseline, target, or peer group. CPOs should establish internal performance first, then use external benchmarks where comparable data is available.
Use this four-step approach:
- Establish the baseline: Calculate the current performance over a representative period. For example, measure requisition-to-order time across several months rather than relying on a single unusually busy week.
- Segment the results: Compare similar plants, categories, project types, or purchasing channels. An urgent maintenance purchase should not automatically be judged against the same cycle-time target as a planned capital purchase.
- Set a business-linked target: Connect the improvement to an operational or financial objective, such as reducing avoidable delays or increasing spend under contract.
- Review progress and exceptions: Track results against the baseline and investigate significant deviations before changing the target.
| KPI | Baseline to establish | Target-setting consideration |
| Procurement cycle time | Current time by process type | Urgency and approval requirements |
| Realized savings | Verified historical savings | Category opportunity and market conditions |
| Supplier OTIF | Delivery performance by supplier | Material criticality and agreed lead times |
| Contract compliance | Eligible spend under contract | Category coverage and approved exceptions |
External benchmarks can add context, but comparisons should use consistent definitions, periods, and peer groups. If a benchmark is not comparable to your operating environment, prioritize an internal improvement target instead.
Procurement Dashboard Comparison with ERP Dashboards and Spend Analytics Solutions
A procurement dashboard focuses on the KPIs and exceptions decision-makers need to monitor, while ERP dashboards and spend analytics solutions serve different, overlapping purposes. The distinction matters when deciding whether existing systems are sufficient or whether a dedicated procurement analytics capability is needed.
| Dimension | Procurement dashboard | ERP dashboard | Spend analytics solution |
| Primary purpose | Monitor procurement performance and trigger action | Report transactions and operational status within the ERP | Analyze expenditure patterns and opportunities |
| Typical data | Sourcing, supplier, purchase, budget, and performance KPIs | Requisitions, orders, receipts, invoices, and accounting records | Spend by category, supplier, business unit, and period |
| Key users | CPOs, procurement leads, finance, operations | ERP users, finance, purchasing teams | Category managers, sourcing teams, finance |
| Main strength | Connects KPIs to business priorities | Provides visibility into recorded transactions | Reveals spending patterns and consolidation opportunities |
| Potential limitation | Depends on accurate data and useful KPI design | May not cover external sourcing workflows or broader supplier risks | May offer limited live process monitoring or action tracking |
An ERP dashboard can provide the transaction data that powers procurement reporting.
A spend analytics solution can reveal that several plants buy similar components from different suppliers at different prices.
A procurement dashboard can bring those findings together with budget variance, supplier delivery performance, and sourcing progress.
These tools are not mutually exclusive. The right architecture depends on existing systems, data availability, reporting needs, and the level of process visibility required.
Businesses that need stronger visibility into expenditure can explore spend insights and budget control as part of their wider procurement data strategy.
Procurement dashboard examples for industrial businesses
Consider three practical scenarios:
- Manufacturing: A plant dashboard flags declining OTIF for a critical bearing supplier while showing rising production requirements.
- Engineering projects: A project dashboard compares committed purchase orders, approved budgets, and outstanding material deliveries.
- Multi-plant sourcing: A category dashboard highlights price differences for comparable electrical components across facilities, prompting a consolidated sourcing review.
These procurement dashboard examples demonstrate that the most useful view depends on the decision being made. A CPO needs a portfolio-level overview; a category manager needs supplier and price comparisons; a plant manager needs visibility into material availability and delivery exceptions.
Should You Extend Existing Dashboards or Buy Procurement Dashboard Software?
The right choice depends on whether existing systems can provide the visibility, detail, and workflow connections procurement needs. A separate platform is not automatically necessary, but an existing dashboard may be insufficient if it cannot support important procurement decisions.
| Evaluation factor | Extend ERP or BI dashboards | Consider dedicated procurement software |
| Current reporting | Existing reports meet most requirements | Important procurement KPIs remain unavailable |
| Data integration | Data is accessible and consistently defined | Sourcing, supplier, and purchasing data remain fragmented |
| Workflow visibility | Existing tools expose required process milestones | Teams need deeper visibility into sourcing and supplier workflows |
| Action management | Current tools support suitable alerts and follow-up | Exceptions require more direct workflow coordination |
| Ownership and cost | Internal maintenance is manageable | Custom development and maintenance create substantial overhead |
A procurement dashboard should be evaluated on demonstrated business fit, not the number of charts or advertised features. A well-configured existing tool may be sufficient for basic reporting, while a broader procurement platform may be justified when the business needs integrated sourcing, supplier, compliance, and purchasing visibility.
Benefits of a Procurement Dashboard for Businesses
A well-designed procurement dashboard helps businesses turn procurement reporting into measurable operational and financial improvements. Its value comes from connecting performance indicators to decisions, not simply making data easier to view.
Key benefits include:
- Earlier cost intervention: Identify unfavorable price movements, budget overruns, and unplanned expenditure before they materially affect margins.
- Stronger supplier decisions: Evaluate suppliers using delivery, quality, cost, and risk indicators rather than price alone.
- Better sourcing accountability: Compare negotiated outcomes with actual purchasing results and identify where contract adoption falls short.
- Improved cross-functional planning: Give finance, procurement, and operations a shared view of commitments, upcoming requirements, and delivery exceptions.
- More focused management reviews: Direct attention toward categories, suppliers, and processes that require intervention.
- Clearer performance communication: Present consistent metrics to executive teams without repeatedly assembling reports from separate spreadsheets.

Why Do Procurement Dashboards Fail, and How Can CPOs Fix Them?
Most dashboard failures stem from poor data, weak KPI design, or a lack of action ownership. Adding more charts rarely solves these underlying problems.
Inconsistent or incomplete data
Supplier names may differ across systems, purchase categories may be inconsistently coded, and invoices may not be linked to contracts. These gaps can distort spend and supplier comparisons.
Fix: Standardize supplier identifiers, category taxonomies, currency conversions, and reporting periods. Display data coverage and flag incomplete records rather than presenting uncertain figures as definitive.
Too many KPIs and unclear targets
Tracking dozens of indicators can distract leaders from the few that affect business outcomes. A metric without a target or decision rule provides limited guidance.
Fix: Select a small executive KPI set, assign each measure a clear owner, and define thresholds for investigation. CIPS recommends that effective KPIs be SMART (specific, measurable, achievable, relevant, and time-bound).
Delayed updates and disconnected workflows
A weekly report may identify a supplier delay only after production planners have already adjusted schedules. Separate sourcing, purchasing, and supplier records can also make it difficult to trace the cause.
Fix: Match refresh frequency to business risk. Critical supply exceptions may require frequent updates, while strategic savings reviews can use monthly reporting. Connect metrics to the underlying workflow wherever possible.
No ownership of corrective action
A dashboard may show rising budget variance for several reporting periods without anyone being accountable for resolving it.
Fix: Assign an action owner, due date, escalation threshold, and follow-up process to important exceptions. Measure whether corrective action improves the KPI over time.
Designing an Effective Procurement Dashboard
An effective procurement dashboard starts with the decisions leaders need to make and then identifies the data and metrics required to support them.
Start with business objectives
Define the priorities first:
- Margin protection
- Supply continuity
- Working-capital control
- Project delivery
- Supplier sustainability
Select KPIs that directly support those goals.
For example, a capital-intensive manufacturer facing material shortages may prioritize supplier lead-time variance and critical supplier exposure over the number of purchase orders processed.
Build role-specific views
Use a shared set of definitions but tailor the presentation to each audience.
- CPO: Savings realization, spend under management, supplier concentration, and strategic sourcing outcomes.
- CFO or finance director: Budget variance, commitments, payment exposure, and verified savings.
- Operations director: Delivery reliability, critical material shortages, and supplier quality.
- Category manager: Quotation competitiveness, price variance, contract compliance, and supplier performance.
Make every metric actionable
A useful procurement dashboard should allow users to move from a headline figure to its underlying explanation.
Include:
- Targets and historical trends.
- Filters for plant, project, category, supplier, and period.
- Alerts for material deviations.
- Drill-downs to relevant orders, contracts, or sourcing events.
- Clear ownership and next steps for exceptions.
Start with a limited set of high-value measures and expand only when users can explain what additional metrics help them decide.
How Can Procurement Dashboard Automation Improve Performance?
Automating a procurement dashboard reduces the effort required to collect, reconcile, refresh, and distribute performance data. It can also help teams identify exceptions sooner, provided the source systems are reliable and the rules are configured correctly.
What should be automated?
Prioritize repetitive tasks such as:
- Importing purchasing, invoice, supplier, and budget data from connected systems.
- Refreshing KPI calculations on defined schedules.
- Sending alerts when spending or supplier performance crosses a threshold.
- Generating recurring management reports.
- Tracking corrective actions and overdue follow-ups.
Benefits of automation
- Less manual spreadsheet preparation and reconciliation.
- More consistent KPI calculations across reporting periods.
- Faster identification of unusual expenditure and delivery risks.
- More time for supplier negotiations and strategic analysis.
- Better traceability of changes, exceptions, and follow-up actions.
Advanced predictive analytics capabilities can extend reporting beyond historical results by helping teams assess potential trends and emerging risks. Forecasts should still be validated against current business conditions and reliable source data.
Is Your Procurement Data Ready for Dashboard Automation?
Automated reporting is only dependable when the underlying data, integrations, and ownership rules are reliable. Before selecting a solution, assess whether your organization can supply the information needed to calculate and explain its priority KPIs.
Use this readiness checklist:
- Data sources: Identify where purchase orders, invoices, budgets, contracts, sourcing events, and supplier performance records originate.
- Common definitions: Standardize supplier identifiers, categories, currencies, reporting periods, and KPI formulas.
- Integration access: Confirm that existing systems can provide the necessary data through supported interfaces, exports, or connectors.
- Data ownership: Assign responsibility for correcting missing records and resolving conflicting figures.
- Refresh requirements: Decide which metrics need frequent updates and which can be refreshed periodically.
- Access and controls: Establish role-based permissions, appropriate audit trails, and safeguards for commercially sensitive supplier information.
Classify each requirement as ‘ready’, ‘requiring remediation’, or ‘unresolved’. This creates a practical view of implementation dependencies before commitments are made.
For example, a manufacturer may have reliable purchase-order data but inconsistent supplier identifiers across plants. In that case, supplier normalization should be addressed before automated supplier concentration or performance reporting is trusted.
The result is a more realistic implementation plan, with data cleanup, integration work, and governance treated as explicit requirements rather than unexpected costs after selection.
How Should CPOs Include ESG Metrics in Procurement Dashboards?
ESG metrics help procurement leaders evaluate environmental and social considerations alongside cost, quality, and supply continuity. They are most useful when tied to defined supplier requirements and measurable business objectives.
Consider including:
- Environmental: Supplier emissions data, recycled material content, waste reduction, and relevant environmental certifications.
- Social: Supplier labor-practice assessments, health and safety performance, and remediation of identified issues.
- Governance: Supplier code-of-conduct compliance, audit completion, and corrective-action closure rates.
For each measure, define the scope, calculation method, evidence requirements, and reporting frequency. Distinguish verified information from supplier declarations and estimated values. Do not compare suppliers using emissions figures calculated on incompatible boundaries.
A procurement dashboard should also connect ESG indicators to sourcing decisions.
For example, a supplier with lower quoted prices but incomplete compliance evidence may require further assessment before award. ESG should inform the decision alongside commercial and operational factors, rather than functioning as an isolated score.
How Can CPOs Validate Procurement Dashboard ROI Before Choosing a Solution?
A procurement dashboard investment should be evaluated against measurable business outcomes, not just reporting convenience. Before comparing vendors, define the current problem, the expected improvement, and the cost of achieving it.
Build a measurable business case
Start with a baseline for the outcomes the solution is expected to improve.
| Value driver | Measurement approach |
| Reduced reporting effort | Hours spent preparing reports before and after implementation |
| Better contract compliance | Change in eligible spend purchased under approved contracts |
| Faster purchasing | Change in cycle time for comparable transaction types |
| Savings realization | Verified savings against an agreed baseline |
| Risk reduction | Changes in defined risk exposure or incident measures |
Estimate annual benefits using realistic assumptions, then subtract software, implementation, integration, training, and ongoing support costs. Avoid counting the same benefit twice: for example, do not count a negotiated price reduction as both realized savings and cost avoidance for the same transaction.
Test vendors with real procurement scenarios
During demonstrations, ask each shortlisted vendor to show how the solution handles:
- A budget variance that needs to be traced to its underlying purchases.
- A delayed critical-material delivery that requires investigation.
- A sourcing event where negotiated savings must be compared with actual results.
- A supplier performance issue that requires an accountable follow-up action.
Check whether the solution can trace the KPI to source data, explain the relevant calculation, and help the appropriate user investigate the exception.
Finally, agree on success measures and review dates before implementation. A pilot or phased rollout can help verify data accuracy, user adoption, and measurable value before wider deployment.
Key Takeaways
- Choose KPIs that connect procurement performance to financial results, supplier reliability, operational continuity, and business risk.
- Combine ERP data, spend analysis, and sourcing performance where needed, while maintaining consistent KPI definitions and traceable source records.
- Make every important metric actionable through clear targets, ownership, alerts, and follow-up processes.
- Automate repetitive reporting only after establishing reliable data and incorporate ESG measures with defined evidence and reporting standards.
Conclusion
Procurement performance increasingly shapes how industrial businesses protect margins, maintain production continuity, and respond to changing supplier markets. The next step for CPOs is to treat performance data as an input to business planning, not merely a record of completed transactions.
When evaluating procurement technology, assess whether a solution can connect the metrics that matter to your organization, explain the causes behind performance changes, and support decisions across procurement, finance, and operations. Also consider integration requirements, data ownership, implementation effort, and whether teams will use the insights consistently.
Evaluating ways to improve procurement visibility? Schedule a Procbay demo to discuss your reporting requirements and assess how a more connected procurement workflow could support your goals.
Frequently Asked Questions
Q: What should a procurement dashboard include?
A: A procurement dashboard should include financial performance, sourcing efficiency, supplier reliability, compliance, and relevant ESG indicators. The exact metrics depend on business priorities, but each KPI should have a defined formula, target, reporting frequency, and accountable owner.
Q: How many KPIs should a procurement dashboard track?
A: There is no universal number. Start with a focused executive set covering the organization’s main objectives, then add role-specific measures where needed. Remove indicators that do not inform decisions or have no clear owner.
Q: What is the difference between a procurement dashboard and spend analytics?
A: A procurement dashboard monitors performance against defined KPIs and highlights exceptions requiring action. Spend analytics examines expenditure patterns, supplier concentration, and category opportunities. Both capabilities can complement each other within a broader procurement analytics strategy.
Q: Can a procurement dashboard integrate with an ERP system?
A: Yes, depending on the solution’s integration capabilities and the ERP’s available interfaces. Integration can bring together purchase orders, invoices, supplier records, and budgets. Validate data synchronization, field mapping, access controls, and refresh frequency before selecting a solution.
Q: How does a procurement KPI dashboard help reduce costs?
A: A procurement KPI dashboard helps identify budget variances, price differences, contract leakage, and missed savings opportunities. Teams can investigate the underlying transactions and take corrective action. Actual savings should be verified against an agreed baseline rather than inferred from negotiated prices alone.
Q: How can businesses measure supplier sustainability through procurement reporting?
A: Businesses can track emissions, supplier assessment coverage, relevant certifications, labor-practice findings, and corrective-action closure. Define measurement boundaries and evidence requirements, distinguish verified data from estimates, and connect results to supplier evaluation and sourcing decisions.
Connect with our procurement experts to tailor an AI-governed sourcing strategy for your enterprise.
Contact Us