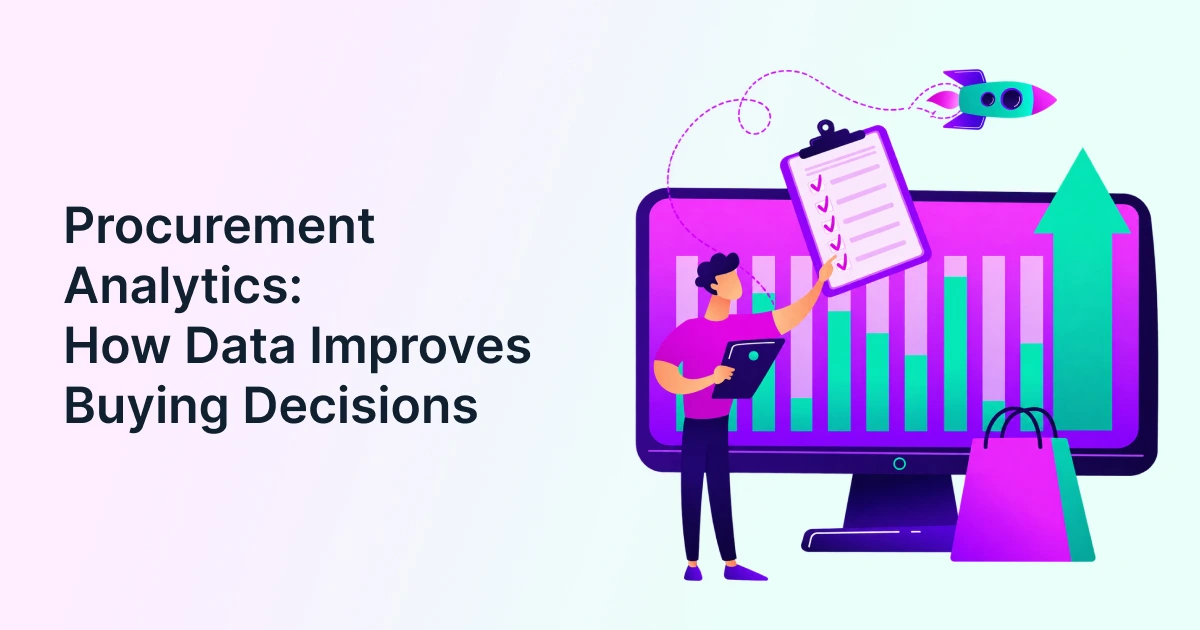
Industrial procurement decisions affect production continuity, working capital, supplier reliability, and operating costs. Yet many organizations still rely on disconnected spreadsheets and month-end reports to understand purchasing performance. Procurement analytics helps teams turn purchasing data into evidence for better decisions, from selecting suppliers and negotiating contracts to managing budgets and anticipating supply disruptions.
For procurement leaders evaluating a digital solution, the challenge is not simply generating more reports. It is identifying which data matters, understanding what it reveals, and translating findings into action. The right approach connects procurement activity with business outcomes, giving procurement and finance teams a shared view of spending, risk, and operational performance.
What Is Procurement Analytics in Industrial Procurement?
Procurement analytics is the systematic collection, integration, and analysis of purchasing data to improve sourcing, supplier management, cost control, and operational decisions. In industrial environments, it connects information from purchase requisitions, RFQs, purchase orders, contracts, invoices, supplier records, and production requirements.
Consider a manufacturing company buying steel, machine components, and maintenance supplies across three plants. Each plant may negotiate independently, use different suppliers, and record similar materials under different names. A consolidated analysis can reveal overlapping purchases, price differences, supplier dependencies, and opportunities to negotiate better terms.
Unlike conventional procurement reporting, which primarily summarizes past activity, analytical processes help teams investigate why results occurred and determine what should happen next.

What Are the Types of Procurement Analytics?
The four main types are descriptive, diagnostic, predictive, and prescriptive analytics. Each answers a different business question, and together they provide a progression from understanding past performance to recommending future actions.
Descriptive analytics: What happened?
Descriptive analytics summarizes historical purchasing activity through spend summaries, supplier reports, category breakdowns, and savings records.
Example: A plant spent 15% more on industrial lubricants this quarter than last quarter. A descriptive report identifies the increase but does not explain its cause.
Diagnostic analytics: Why did it happen?
Diagnostic analytics investigates the reasons behind a result by comparing transactions, prices, supplier changes, purchasing volumes, and contract terms.
Example: Further investigation reveals that the lubricant increase came from emergency purchases at non-contract rates rather than higher production demand.
Predictive analytics: What is likely to happen?
Predictive analytics uses historical patterns and relevant current data to estimate future outcomes. Depending on data quality and model design, it can help forecast category demand, supplier delays, cost movements, and budget overruns.
Example: A procurement team identifies a recurring increase in spare-parts demand before its annual maintenance shutdown and adjusts its purchasing plan accordingly.
Prescriptive analytics: What should we do?
Prescriptive analytics recommends possible actions based on objectives, constraints, and available evidence. Recommendations may consider price, delivery reliability, supplier capacity, inventory needs, and risk.
Example: A model recommends splitting an order between two qualified suppliers because the lowest-priced supplier cannot meet the required delivery schedule alone.
Organizations do not need to implement all four types simultaneously. A useful starting point is reliable descriptive and diagnostic analysis, followed by predictive and prescriptive capabilities where the business case justifies them.
Which Procurement Activities Benefit Most from Analytics?
Procurement analytics creates value when it addresses specific purchasing decisions rather than producing reports without a clear owner or purpose.
The most relevant activities for industrial organizations include:
- Spend analysis: Identify category-level expenditure, duplicate suppliers, fragmented buying, and opportunities to consolidate demand.
- Strategic sourcing: Compare supplier quotations, historical prices, total landed costs, and sourcing outcomes before awarding business.
- Supplier performance management: Track delivery reliability, rejection rates, quality incidents, responsiveness, and commercial performance.
- Contract compliance: Identify purchases outside negotiated agreements, missed rebates, unauthorized price changes, and upcoming renewals.
- Budget management: Compare planned, committed, and actual spending to detect potential overruns before they affect financial forecasts.
- Demand planning: Examine historical consumption, project schedules, maintenance requirements, and purchase patterns to improve sourcing decisions.
For example, if four manufacturing plants purchase the same component from different suppliers, an analysis may reveal that consolidated demand could improve negotiating leverage. However, consolidation should not proceed automatically if it creates excessive dependence on one supplier or increases transportation costs.
Effective analysis therefore combines financial data with operational context.
Organizations can strengthen this foundation by connecting requests to downstream purchasing activity. Procbay’s procurement intake and demand capture capabilities help structure incoming requirements, making demand easier to classify, review, and analyze.
KPIs Procurement Leaders Should Track for Analytics
| KPI | What it measures | Decision it supports |
| Realized cost savings | Verified reduction against an agreed baseline | Assess sourcing outcomes |
| Spend under management | Share of addressable spend governed by procurement | Identify control gaps |
| Maverick spend rate | Purchases outside approved processes or agreements | Improve compliance |
| Purchase order cycle time | Time from a defined starting event to PO issuance | Locate process delays |
| Supplier on-time delivery | Share of deliveries received by the agreed date | Assess supply reliability |
| Contract compliance rate | Share of applicable spend following contract terms | Reduce commercial leakage |
| Purchase price variance | Difference between actual and reference purchase prices | Investigate price movements |
| Budget variance | Difference between actual or committed spend and budget | Manage financial exposure |
Each metric needs a consistent definition. For example, realized savings should distinguish negotiated price reductions from actual savings achieved after accounting for volumes, implementation costs, and changes in specifications.
Cycle time also requires a clear starting and ending point. Measuring from requisition submission to purchase order issuance will produce a different result from measuring the entire sourcing process.
Procurement reporting becomes more useful when KPIs have owners, targets, review frequencies, and escalation thresholds. Procurement leaders should also pair internal measures with business outcomes such as production interruptions, material quality, and stakeholder satisfaction.
How Do You Conduct Procurement Analytics Effectively?
A repeatable analytical process helps organizations move from fragmented records to defensible decisions. The following five steps provide a practical starting point.
Step 1: Define the decision to improve
Start with a business problem rather than a software feature. Examples include unexplained price variation, excessive emergency buying, supplier concentration, or poor budget visibility.
Specify what a successful outcome would look like and which team owns the decision.
Step 2: Consolidate relevant data
Bring together the records needed to investigate the problem. Depending on the use case, these may include ERP transactions, purchase orders, invoices, contracts, supplier master data, and sourcing event records.
Check for missing fields, duplicate supplier records, inconsistent units of measurement, and incomplete transaction histories.
Step 3: Standardize and classify information
Map similar products and suppliers to consistent categories. For instance, one plant may record a component as a “bearing assembly,” while another uses a manufacturer-specific part description.
Classification makes comparisons more meaningful. Without it, apparent differences may simply reflect inconsistent data entry.
Step 4: Analyze patterns and validate findings
Use comparisons, trend analysis, segmentation, and exception detection to identify possible causes. Validate significant findings with category managers, plant teams, finance, or suppliers before changing purchasing decisions.
Step 5: Convert findings into accountable actions
Assign each opportunity an owner, expected outcome, deadline, and verification method.
If an analysis identifies purchases above contracted rates, the action might be to correct pricing in the purchase order workflow, investigate supplier invoices, or revise buying guidance. The team should subsequently measure whether the corrective action worked.

How Does Procurement Analytics Differ for Buyers and Suppliers?
Buyers and suppliers use purchasing data for different purposes. Buyers focus on value, compliance, resilience, and internal demand; suppliers focus on demand visibility, fulfilment, commercial performance, and capacity planning.
| Analytical perspective | Buyer priorities | Supplier priorities |
| Demand | Forecast purchasing needs across plants | Anticipate order volumes and production requirements |
| Cost | Compare prices, total cost, and contract terms | Understand cost drivers and protect margins |
| Performance | Monitor quality, delivery, and service levels | Track delivery performance and customer requirements |
| Risk | Assess concentration, continuity, and compliance | Identify demand volatility and customer dependency |
| Planning | Optimize sourcing and budgets | Align capacity, inventory, and lead times |
For example, a manufacturer may use historical orders to identify excessive dependence on a single casting supplier. The supplier, using shared forecasts and order visibility, may identify an opportunity to reserve production capacity before demand peaks.
The two perspectives can reinforce each other when information is shared appropriately. However, buyers should protect confidential pricing, internal budgets, and competitive sourcing information. Suppliers should receive only the data needed for collaboration and fulfilment.
Challenges That Limit Procurement Analytics
The main challenges are inconsistent data, disconnected systems, unclear metric definitions, limited analytical skills, and weak follow-through. Technology alone cannot resolve these problems if the underlying processes remain unreliable.
Poor data quality
Duplicate suppliers, inconsistent material codes, missing contract references, and incorrect units can distort comparisons. Establishing data ownership and validation rules is essential before relying on advanced models.
Disconnected procurement systems
Purchasing information may sit across ERP platforms, spreadsheets, sourcing tools, and supplier portals. Manual consolidation delays analysis and makes it difficult to trace findings back to source transactions.
Metrics that encourage the wrong behavior
A team measured only on unit-price reductions may choose a cheaper supplier with higher rejection rates or unreliable delivery. Balanced measures should account for quality, continuity, compliance, and total cost.
Limited adoption and accountability
Even accurate procurement insights have little value if managers do not trust them or cannot act on them. Involve category owners and finance teams when defining metrics, validating findings, and assigning actions.
Unclear return on technology investment
Organizations may invest in dashboards without defining how those dashboards will change purchasing decisions. Each use case should have a baseline, an expected outcome, and a method for verifying results.
Building the Business Case for Procurement Analytics
A credible business case should connect procurement analytics to measurable financial or operational improvements rather than treating better visibility as the return on investment.
Start with three categories of value:
- Financial value: Verified savings, reduced off-contract purchases, fewer pricing discrepancies, and improved budget control.
- Operational value: Less manual reporting, faster exception resolution, and reduced time spent reconciling data.
- Risk-related value: Earlier identification of supplier concentration, delivery issues, and potential contract non-compliance.
For each proposed use case, establish a baseline and define how improvement will be measured.
For example, if a manufacturer wants to reduce off-contract purchasing, record the current level of eligible spend outside approved agreements. Estimate the achievable reduction, then verify actual changes after corrective measures are introduced.
A simple calculation can look like:
Net ROI = [(Annual Benefits – Annual Costs)/Annual Costs] x 100
Include software fees, implementation, integration, data preparation, training, and ongoing administration in the cost estimate. Avoid counting negotiated savings as realized savings until the financial benefit can be verified.
Decision rule: Prioritize use cases with a measurable baseline, an accountable owner, accessible data, and a credible path from insight to action.
How Does Automation Improve Procurement Analytics?
Automation makes analysis timelier and more repeatable by reducing manual data preparation, refreshing metrics as transactions change, and flagging exceptions for review. It can also connect findings to workflows where procurement decisions occur.
Traditional spreadsheet-based analysis often depends on someone exporting data, reconciling records, updating formulas, and distributing reports. By the time the report reaches a decision-maker, the purchasing situation may have changed.
An automated approach can support:
- Scheduled or event-driven data refreshes.
- Standardized category and supplier classifications.
- Alerts for unusual price movements, contract deviations, and budget risks.
- Forecasts based on historical patterns and available operational data.
- Traceable recommendations linked to the underlying transactions.
- Human review of significant exceptions before actions are taken.
For example, a predictive model may flag that a maintenance category is likely to exceed its quarterly budget. A procurement manager can investigate the underlying requests, confirm upcoming maintenance needs, and work with finance to decide whether to adjust the forecast or change the sourcing plan.
Procbay’s Predictive Analytics Agent is designed to support forward-looking analysis, including forecasts related to savings, cycle times, and procurement risks. On the other hand, its Spend Insights & Budget Control capabilities connect spend visibility with budget oversight.
Evaluating the Procurement Analytics Software
When comparing procurement analytics software, evaluate how well each option connects reliable data to decisions, controls, and measurable outcomes. A polished interface is useful, but it should not outweigh data coverage, usability, integration, or governance.
Use the following criteria when shortlisting vendors:
- Data integration: Can the solution connect ERP, purchasing, contract, supplier, and finance records?
- Analytical depth: Does it support historical analysis, root-cause investigation, forecasting, and actionable recommendations?
- Industrial relevance: Can it analyze spend across categories, plants, entities, and suppliers while accommodating operational constraints?
- Dashboard flexibility: Can users filter information by category, plant, business unit, supplier, and time period?
- Workflow connection: Can users investigate an exception and initiate a relevant action without rebuilding the process elsewhere?
- Governance: Are access controls, metric definitions, audit trails, and recommendation explanations available?
- Implementation effort: What data preparation, integration work, training, and ongoing maintenance will be required?
- Business value: Can the vendor demonstrate how the proposed use cases will be measured against an agreed baseline?
A procurement analytics dashboard should help different stakeholders answer their own questions. A CPO may need a consolidated view of savings, supplier exposure, and compliance. A category manager may need price variance and supplier comparisons. Finance may prioritize committed spend, forecast accuracy, and budget exceptions.
Compare solutions using a defined scenario rather than a generic product presentation. For example, ask vendors to demonstrate how they would identify off-contract purchases, trace the cause, estimate the financial impact, and support corrective action.
For teams seeking to reduce process delays as well as improve visibility, Procbay’s related guide on reducing procurement cycle time without increasing costs provides additional context for evaluating operational improvements.
Choosing the Right Procurement Analytics Model
The right procurement analytics model depends on where purchasing data resides, how much analysis the team needs, and whether findings must trigger operational action. Buyers should compare three approaches before shortlisting vendors.
| Solution model | Best suited for | Main consideration |
| ERP-native reporting | Organizations with centralized purchasing data and straightforward reporting needs | May offer limited visibility into transactions outside the ERP |
| Standalone analytics software | Enterprises managing data across multiple ERPs, procurement systems, and contract repositories | Requires integration and data governance |
| Analytics within an integrated procurement platform | Teams seeking to connect insights with sourcing, approvals, and spend controls | Evaluate workflow coverage alongside analytical depth |
Use these questions to narrow the choice:
- Do we need consolidated visibility across multiple plants, business units, and systems?
- Are historical reports sufficient, or do we need forecasting and recommendations?
- Must users act on findings within the same platform?
- Can our existing systems provide reliable data without extensive manual preparation?
Decision rule: Choose the simplest model that meets the organization’s data coverage, analytical, and workflow requirements. A larger platform is not automatically a better investment.
Questions to Ask Vendors During Procurement Analytics Demo
| Demo question | What to validate |
| Can you consolidate spend across our plants and systems? | Data coverage, supplier deduplication, and category consistency |
| Can you trace a price variance to its underlying transactions? | Drill-down capability and evidence behind findings |
| Can you identify purchases outside contract terms? | Contract references, exception detection, and compliance reporting |
| Can you flag a potential budget overrun? | Forecast assumptions, alert thresholds, and supporting data |
| Can users move from an insight to a corrective action? | Workflow integration, ownership, and audit trail |
| How do you measure analytical accuracy? | Validation methods, error handling, and human review |
Where possible, use anonymized examples from your own purchasing data. Ask vendors to explain what happens when records are incomplete, suppliers are duplicated, or forecasts are uncertain.
Also distinguish capabilities available today from those that require additional modules, integrations, customization, or future development.
Key Takeaways
- Start with a specific business decision, then identify the data and KPIs needed to improve it.
- Combine financial measures with supplier quality, delivery reliability, compliance, and operational outcomes.
- Build trustworthy data and clear accountability before introducing advanced predictive or prescriptive models.
- Evaluate software on its ability to connect analysis with action, not simply its ability to display more metrics.
Conclusion
The next step in procurement analytics is to make purchasing decisions more resilient to changing demand, supplier constraints, and financial pressure. Procurement leaders can prepare for this shift by defining decision ownership, improving data accountability, and agreeing with finance on how business value will be verified.
Technology selection should follow those priorities. A solution is worth considering when it fits existing systems, supports the organization’s operating model, and demonstrates practical value through relevant use cases. It should also give teams enough transparency to challenge recommendations rather than accept them blindly.
If your organization is evaluating ways to connect spend visibility and forecasting, a 30-minute platform walkthrough with the Procbay team can help you assess the fit.
Frequently Asked Questions
Q: What is the difference between procurement analytics and spend analysis?
A: Spend analysis focuses primarily on where money goes and how expenditure is distributed. Procurement analytics covers a broader range of questions, including supplier performance, process efficiency, budget forecasting, contract compliance, and future purchasing decisions.
Q: What data is needed to start procurement analytics?
A: Start with purchase orders, invoices, supplier records, categories, contracts, and available budget information. Add sourcing events, delivery performance, and requisition data as needed. Consistent identifiers and reliable historical records improve the quality of comparisons.
Q: Which procurement analytics KPIs should organizations prioritize?
A: Prioritize metrics tied to current business problems. Common starting points include realized savings, spend under management, contract compliance, supplier on-time delivery, purchase order cycle time, and budget variance. Define each metric consistently before comparing performance.
Q: How does procurement analytics software differ from a procurement analytics dashboard?
A: A dashboard presents selected metrics and trends, while procurement analytics software may also integrate data, investigate patterns, generate forecasts, and identify exceptions. Some platforms connect these findings directly to purchasing workflows and approvals.
Q: Can procurement analytics predict supplier risks and cost increases?
A: It can estimate risks and cost movements when historical data, relevant signals, and suitable models are available. Predictions remain uncertain, so teams should validate important alerts, monitor model performance, and maintain alternative sourcing plans.
Q: How can organizations measure the ROI of procurement analytics?
A: Establish a baseline before implementation and track verified improvements against it. Measure outcomes such as realized savings, reduced off-contract spend, lower manual reporting effort, improved forecast accuracy, and fewer supply interruptions, while accounting for implementation and operating costs.
Connect with our procurement experts to tailor an AI-governed sourcing strategy for your enterprise.
Contact Us