Summary
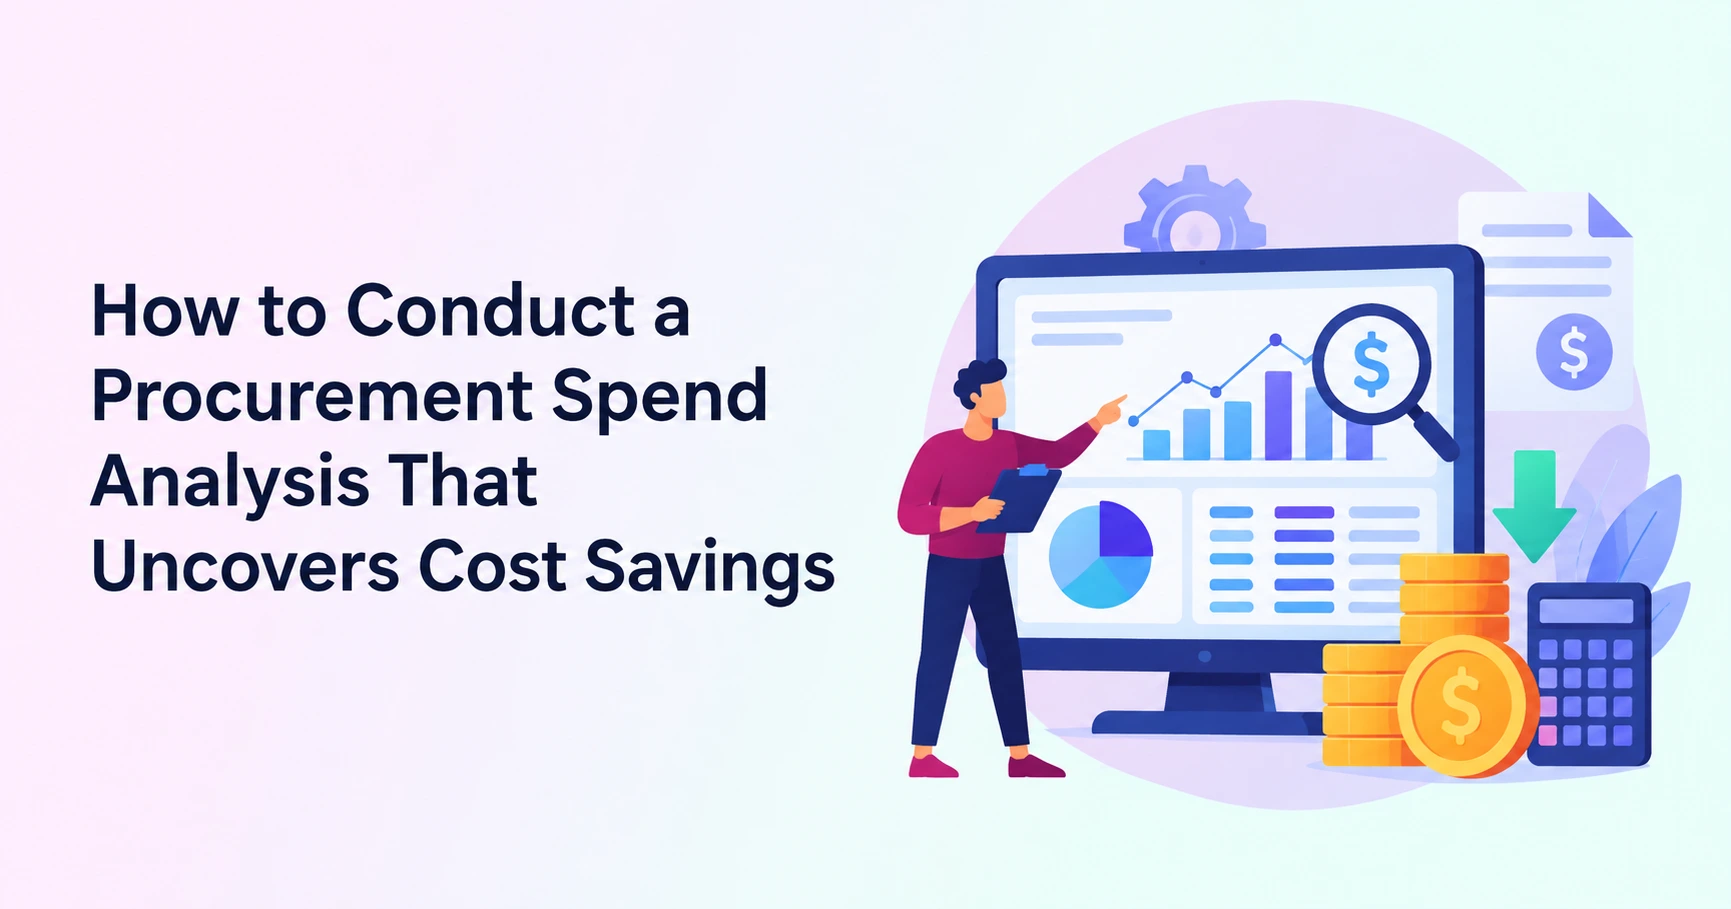
Spend analysis helps procurement teams understand where money is going, which suppliers and categories account for the most spend, and where sourcing or compliance opportunities may exist. The challenge is that enterprise spend data is often distributed across ERP systems, supplier records, purchase orders, invoices, and other transaction sources. This article provides a step-by-step framework for executing an enterprise procurement spend analysis, covering data extraction, taxonomy mapping, and value identification. You will learn how to transition from reactive annual spend audits to real-time, automated spend visibility. Explore how Procbay’s Spend Insights & Budget Control module consolidates multi-entity purchasing data to drive intelligent sourcing decisions.
In short: Spend analysis in procurement is the systematic process of aggregating, cleansing, classifying, and evaluating historical expenditure data across all business units. It establishes enterprise spend visibility, revealing cost-reduction opportunities, maverick spend, supplier concentration risks, and contract leakage to drive strategic sourcing decisions.
ERP implementations promise clean spend data, yet most CPOs still spend weeks assembling board decks out of static spreadsheets. Transactional data sits trapped across business units, regional legacy accounting systems, and purchase order line items filled with free-text descriptions.
Without clean visibility into historical purchasing, category strategies rely on estimates rather than facts. Off-contract buying goes unnoticed, volume discounts lapse, and supplier concentration risk mounts silently. Running an effective spend analysis platform turns fragmented transactional logs into a structured baseline for cost reduction and risk mitigation.

What Is Spend Analysis and Why Does Manual Spend Visibility Fail?
To build accurate spend visibility, you need a systematic pipeline that extracts transactional data from every purchasing channel, cleanses text errors, maps line items to a standard taxonomy, and analyzes category distribution. This foundation allows procurement teams to identify addressable spend, consolidate supplier footprints, and enforce contract compliance across the enterprise.
Manual approaches fail primarily because enterprise purchasing data is notoriously fragmented. When an organization operates three different ERPs alongside legacy accounting software, supplier names are entered inconsistently. “IBM,” “International Business Machines,” and regional subsidiaries end up logged as separate entities.
This fragmentation hides aggregate spend, preventing category managers from negotiating enterprise-level volume discounts. Free-text purchase order descriptions compound the problem, hiding off-contract purchasing inside broad general ledger accounts.
Manual spreadsheet consolidation takes months, rendering the resulting reports outdated before leadership ever reviews them. By the time a category manager identifies a compliance leakage trend, the fiscal quarter has already closed.
How Do You Execute a Step-by-Step Procurement Spend Analysis Framework?
Step 1: Define the scope and objective
Determine which entities, categories, purchasing channels, and historical periods will be included. Define whether the analysis is intended to identify sourcing opportunities, improve contract compliance, assess supplier concentration, establish a savings baseline, or support category strategy.
Step 2: Extraction & Aggregation
A common starting point is 12–24 months of historical data, with the period extended where seasonality, contract cycles, or category volatility require a longer view. This includes accounts payable invoice files, purchase orders, corporate payment card logs, and general ledger details. Ensure the payload contains supplier names, tax IDs, invoice line-item descriptions, unit costs, quantities, and business unit tags.
Step 3: Cleansing & Enrichment
Standardize supplier entity records to resolve naming discrepancies and establish corporate parent-child hierarchies. Normalize currency values and correct invoice entry errors. Where appropriate, enrich supplier records with external identifiers, ownership information, diversity credentials, financial indicators, or other third-party data.
Step 4: Taxonomy Classification
Map itemized transactions to a standard classification system such as UNSPSC or eClass, or apply a tailored internal category taxonomy. Classification should be granular enough to reveal actionable sourcing opportunities. For many categories, that may require item- or subcategory-level classification rather than broad GL codes.
Classification must ideally extend to Level 3 or Level 4 granularities; high-level General Ledger summaries fail to reveal specific sourcing levers.
Step 5: Opportunity Identification & Sourcing Execution
Analyze the classified dataset to isolate actionable savings opportunities. Look for price variance across identical SKU purchases, unmanaged tail spend, high supplier concentration, and contract non-compliance. Map these findings directly into scheduled sourcing events within your Strategic Sourcing platform.
What Spend Analytics Software Capabilities Drive Measurable Savings?
To achieve recurring spend savings, you need advanced spend analytics tools that provide multi-dimensional spending visibility, automated line-item classification, real-time price variance tracking, and tail spend identification.
Core capability areas include:
- Tail Spend Management: Unmanaged purchases below standard sourcing thresholds frequently conceal significant value leakage. Automated classification surfaces fragmented tail spend across business units, pointing out aggregation opportunities for eAuctions or catalogue enablement.
- Price Variance Tracking: Identifies instances where different business units purchase identical SKUs or services from the same vendor at varying rates, allowing teams to standardize terms at the lowest negotiated rate.
- Contract Compliance Monitoring: Cross-references AP line items against active agreements to flag off-contract, maverick purchasing instantly.
- Supplier Concentration Risk: Highlights excessive financial dependency on single suppliers within critical operational categories, strengthening risk management.
Category teams using Procbay’s Predictive Analytics Agent can automatically flag rate variances and run automated supplier consolidation scenarios, replacing manual spreadsheet analysis with real-time strategic insights.
Key Statistics
- Firms that use digital to manage tail spend can cut their annual expenditures by 5% to 10%, on average. [Source: 2019 BCG Analysis]
- Catalogues enforcing spending regulations and compliance reduce transactional costs by as much as 30% to 40% per transaction. [Source: 2019 BCG Analysis]
Why Spend Analysis AI Cannot Completely Replace Category Manager Expertise?
While automated classifiers process thousands of lines per minute, machine algorithms can struggle with context-heavy enterprise line items. A PO line labeled “Custom Bracket Refit – Project Bravo” might be misclassified as general facility maintenance rather than specialized engineering support.
A model may recognize that two descriptions are similar while missing an engineering distinction that changes how the item should be sourced. Category managers provide the business context needed to validate those classifications and decide whether an apparent savings opportunity is actionable.
AI classification must operate alongside human governance, allowing category experts to review classification confidence scores, adjust taxonomy rules, and validate strategic insights before launching sourcing events.
Spend Analysis vs. Spend Management vs. Spend Control
| Concept | Purpose |
| Spend analysis | Understand what the organization has spent |
| Spend analytics | Use tools and analysis to continuously identify patterns, risks and opportunities |
| Spend management | Manage how purchasing decisions are made and controlled |
| Spend control | Apply policies, budgets and controls before/during transactions |
Illustrative Example: How Misclassified Tail Spend Can Create Value Leakage
The following example is hypothetical and is intended to illustrate the mechanics of spend analysis.
A multinational industrial equipment manufacturer operating 14 production facilities across North America faces severe margin compression due to rising indirect material costs.
Each facility operates its own regional ERP instance with distinct vendor masters. Indirect maintenance, repair, and operations (MRO) spend is logged using generic general ledger codes without itemized catalog descriptions. Plant managers routinely issue local purchase orders to regional distributors.
With spend data fragmented across 14 independent systems, corporate procurement is lacking visibility into aggregate consumption. The enterprise maintains active relationships with 112 separate MRO distributors.
An independent benchmark audit revealed that identical safety equipment, power tools, and lubricants were purchased at unit price variances as high as 42% across facilities. Off-contract maverick spend reached 28% of total indirect outlay. Unconsolidated purchasing and uncaptured volume tier rebates resulted in an estimated $4.2M in annual value leakage.
The enterprise consolidated transactional data across all 14 ERP instances into a unified analytics environment. Automated text normalization reconciled local vendor names under corporate parent structures, mapping 18 months of AP line items to a standardized UNSPSC taxonomy.
The audit revealed that 65% of the regional distributors sourced products from the same three primary manufacturers. Procurement leveraged this aggregated volume data to initiate an eAuction, consolidating MRO supply down to two strategic national distributors. This intervention captured $3.1M in direct savings within the first year and reduced off-contract purchasing to under 4%.

Quantifying Saving Opportunities
| Price variance savings | Current price − benchmark/target price × eligible volume |
| Supplier consolidation opportunity | Addressable spend × negotiated improvement |
| Contract leakage | Off-contract spend × recoverable difference |
| Tail-spend opportunity | Addressable tail spend × realistic intervention rate |
| Cost avoidance | Baseline expected cost − negotiated/current cost |
An identified opportunity is not the same as realized savings. Savings should be measured against an agreed baseline after the sourcing or control intervention.
Manual Spreadsheet Spend Analysis vs. AI-Orchestrated Spend Analytics
| Dimension | Manual analysis | Automated analytics |
| Data consolidation | Manual extraction and merging | Automated where integrations are configured |
| Supplier normalization | Rule/spreadsheet driven | Automated matching with review |
| Classification | Manual/rule-based | Automated classification with confidence/review |
| Refresh cycle | Periodic | Continuous or scheduled, depending on integration |
| Opportunity detection | Analyst-driven | Automated flags plus analyst validation |
| Auditability | Often spreadsheet-based | Centralized activity/history where supported |
| Sourcing handoff | Manual | Can connect insights to sourcing workflows |
When spend analytics connects directly with contract intelligence, procurement moves from passive spend tracking to proactive leak prevention. Connecting AP data with active agreement terms ensures pre-negotiated discount tiers are automatically applied to every purchase order.
Conclusion
Spend analysis is not a static annual exercise; it is the operational foundation of modern strategic sourcing. Relying on manual spreadsheet audits exposes enterprises to contract leakage, unmanaged tail spend, and supplier concentration risk.
Transitioning to automated spend analytics provides complete visibility across all business units, turning historical accounts payable logs into actionable sourcing strategies.
Modern procurement platforms streamline data ingestion, taxonomy mapping, and opportunity identification, allowing teams to act on market insights quickly.
If your team is evaluating how to bring AI-governed structure to your spending workflows, Procbay’s platform walkthrough can clarify what that looks like in practice. Reach out to us to schedule a demo today.
Frequently Asked Questions
Q: What is spend analysis in procurement?
A: Spend analysis in procurement is the process of collecting, cleansing, classifying, and analyzing expenditure data to increase spend visibility. It allows organizations to identify cost-reduction opportunities, chances to reduce maverick spend, manage supplier risk, and ensure contract compliance across all business units and sourcing channels.
Q: What are the key steps in conducting a spend analysis?
A: The core framework includes four main steps: data extraction from ERPs and accounting systems, data cleansing and supplier deduplication, taxonomy classification down to granular category levels, and opportunity identification where procurement teams analyze purchasing patterns to execute targeted sourcing events.
Q: How does spend analysis help reduce maverick spend?
A: Spend analysis correlates accounts payable invoices and purchase order line items against active contract databases. By highlighting non-compliant purchasing patterns and off-contract vendor usage across specific departments, procurement can enforce contract usage and guide purchasing back toward negotiated supplier agreements.
Q: How frequently should an enterprise refresh its procurement spend data?
A: While traditional organizations run manual spend audits annually or quarterly, modern procurement teams utilize automated analytics platforms that refresh spend data continuously or weekly. Real-time updates ensure category managers identify price variances and contract leakage immediately rather than months after value loss occurs.
Q: If enterprise ERP data is highly fragmented, can we still run an accurate spend analysis?
A: Yes. Modern spend analytics tools specialize in multi-system data extraction, using automated normalization algorithms to reconcile conflicting vendor names, deduplicate entity records, and map disparate line-item descriptions into a single, standardized corporate taxonomy.
Q: What key metrics should a procurement manager track during spend analysis?
A: Procurement managers should track total addressable vs. non-addressable spend, contract compliance rates, maverick spend percentages, price variance for identical SKUs across units, supplier concentration ratios, and the proportion of unmanaged tail spend relative to total expenditure.
Q: How do AI spend analysis tools handle multi-currency and multi-entity data?
A: AI spend tools automate currency conversion using historical exchange rates tied to transaction dates, standardizing accounts payable details across global entities while preserving regional tax, local vendor, and business unit metadata for localized reporting.
Connect with our procurement experts to tailor an AI-governed sourcing strategy for your enterprise.
Contact Us